Formal: Silent Prayer
Since the horrible event, innumerable calls for prayer have been made.
On the 14th of September there was a special emphasis on such collective
spiritual moments, including major organized periods of silence in Europe
and America. Doug Mast made a specific formal prediction for a deviation
of the Chisquare "over the time periods 1000 to 1003 GMT, corresponding to
a European organized mourning and
the time period 1200 to 1203 EDT (1600 to 1603 GMT) corresponding to the
beginning of the Washington service and many organized mourning events in
the Eastern US." Here is the resulting graph.
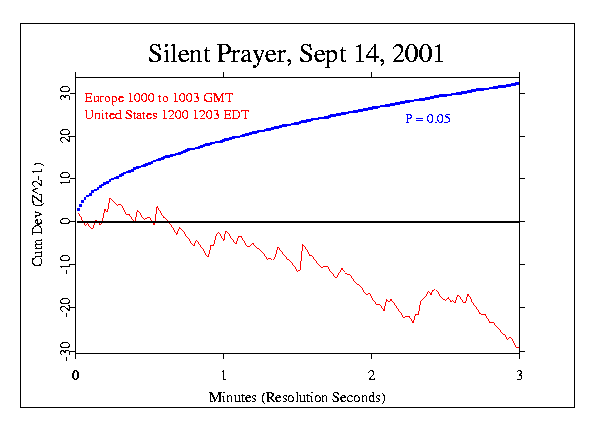
The picture is very compelling, I think, although it does not confirm
the formal prediction. Instead, the trend shows a marginally significant
decrease in the deviations of the egg data. The Chisquare is 150.68
on 180 degrees of freedom, with probability 0.9455. The trend is steadily
opposite to the usual (and specified) direction, but somehow it looks
right -- symbolic of the moment's contrast to the preceding days.
Although there was no formal prediction made for a reaction of the EGG
network to the event, we do not want to forget the heroic
sacrifice that brought down the fourth hijacked plane. Exploratory
analyses of the time prior to the crash itself suggest a poignant
correlation an extraordinary rise in the cumulative deviation
followed by a precipitous fall.
Exploratory Work by Independent Analysts
Dean Radin produced a variety of analyses of the September 11 events.
Some samples are presented here, with more in the extended analysis
page. A paper with a detailed analysis of many aspects of the data gives
special attention to the location of
the eggs. Dean's treatment of the low-level data is different from the
GCP's standard approach. Instead of a composite (Stouffer) Z across eggs,
he calculates the Z-score per egg and sums the squared Z-scores and
degrees of freedom across eggs. This responds to the variability among the
eggs while the standard analysis responds to correlation among the eggs.
This approach also mandates empirical instead of theoretical variance for
the Z-score calculations. Dean uses sliding window smoothing or moving
averages of the data across time. This can make interpretation difficult
because the results depend very heavily on the choice of parameters such
as the window width and centering. Because Dean also tries several sets of
parameters to "optimize" the presentation, there is a form of data
selection, so any probability or odds ratio that appears in the figures is
very much an overstatement. It is, moreover, very difficult to compensate
with the usual Bonferroni adjustment for multiple analysis because of the
uncertain number of analyses he does. Dean believes that work of this kind
is legitimate in the context of good evidence from properly designed
studies. I present the analyses here with the caveat that they have no
evidentiary value, although as complements to formal analysis, they may
lead to useful questions. I should add that Dean says everything he tried
showed unexpected structure in the data from September 11.
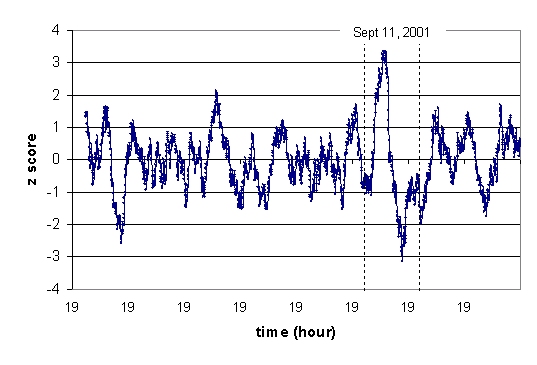
The following graph shows results for a 6-hour sliding window covering
Sept 6 - 13. Dean identifies the peak value in this graph as occurring at
9:10 AM, Sept 11. However, the algorithm that he used for the sliding
window averages the data for the six hours preceding the plotted
point. Thus, in terms of the original, unsmoothed data, the "peak" weight
of the averaging actually occurs three hours earlier, at 06:10. (The
"19's" on the x-axis indicate 19:00 on each day.) In any case, the drop
between this peak and the equally strong negative peak about 7 hours later
is extreme, corresponding to 6.5 sigma (odds against chance of 29 billion
to 1 if this were calculated for an a priori prediction). Dean
observes that "such large changes will eventually occur by chance, of
course, but this particular change happened during an unprecedented event,
suggesting that this `spike' and `rebound' were not coincidental." A
permutation analysis shows that the likelihood of getting a 6.5 sigma drop
in Z-scores (based on a 6-hour sliding window) in one day, and within 8
hours or less (as observed) is p = 0.002.
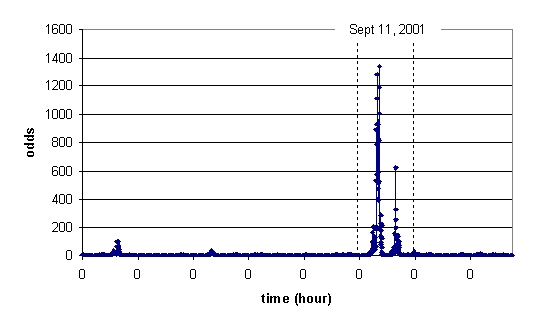
The next figure shows the 2-tailed probabilities associated with the
smoothed Z-score as odds ratios. There is an extraordinary spike near the
time of the attacks, driven by large deviations that precede the first
plane crashing into the World Trade Center towers; its weighted center is
at 06:10, corresponding to the peak in the Z scores. The second spike
occurs roughly seven hours later, with the weighted center at about 1:00
pm. The "0's" in the x-axis shows the start of each day.
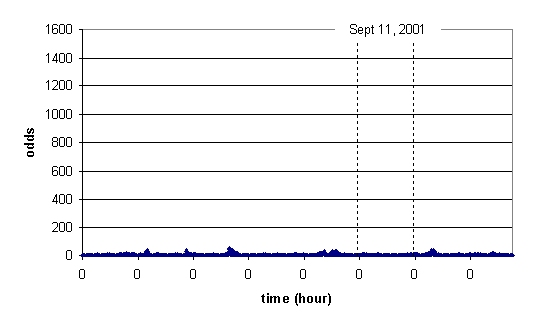
To help assure that there was no mistake in the processing, this same
figure was recreated using algorithmically generated pseudo-random
data instead of the real data generated by the truly random eggs
located in countries all around the world. This figure speaks for itself.
Peter Bancel has taken another independent perspective, focusing on the
temporal
development or autocorrelation of the data to gain perspective on possible
linkage of the eggs' output over time. He explains "Basically, what I do
is do an autocorrelation of the sec-by-sec Stouffer z's over regs, using
Fourier techniques. The resulting autocorrelations are then normalized to
the Sqrt (of the number of data pts-the lag). This gives a distribution of
"z" values that should be very closely N(0,1) distributed. I then
visualize the result by taking the cumulative sum, much as we do for a
classic reg experiment.
"The large rise in the autocor 8-12 figure can be understood as coming
from a large excusion in the cumulative deviation of the z-scores
(sec-by-sec Stouffer's z - not the z^2) which occurs from 9:50 to 11:50.
This positive excursion as an isolated data set has a two-tailed-pvalue of
2 x 10⁻⁴ (z=3.71). So it's strong and it lasts for 1.9 hours. Placed in
the context of a 24 hours data window I guess a Bonferroni correction
would put the pval at 2.5 x 10⁻³."
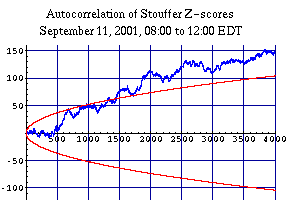
A much more refined analysis of autocorrelation shows the relative
predictability of the device variance over lags up to four hours, second
by second, passing each autocorrelation window over the full 24 hour EDT
day. The next figure shows the data from Sept 11 in red, compared with 60
surrounding days of August and September. The latter show a cloud of
essentially random traces, nearly all of which remain within a 5%
probability envelope. In stark contrast, the Sept 11 autocorrelation is
consistently large over the first hour of lags, continuing at a lower but
still significant level for the second hour, after which the cumulative
deviation line becomes essentially flat again. Besides the obvious
difference from the comparison traces, an indication of the likelihood is
given by the fact that the cumulative trace penetrates a one in a million
envelope -- but see below.
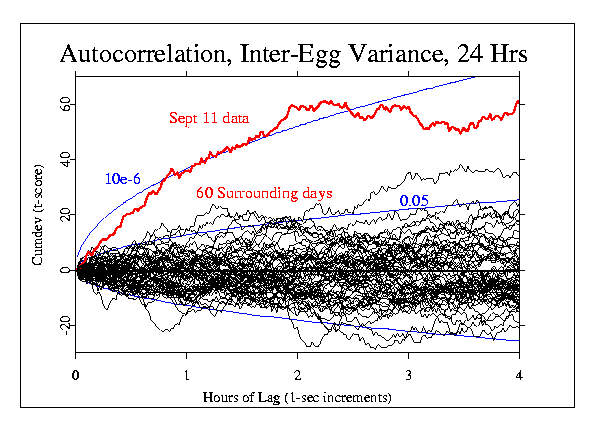
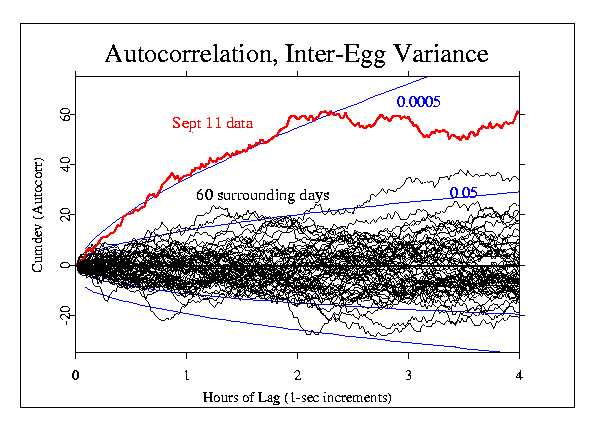
Further analysis using a more appropriate asymmetrical distribution
suggests a less extreme probability of 0.0005. This is shown in the next
figure. In any case, there is little question that these data show
structure where there should be none.
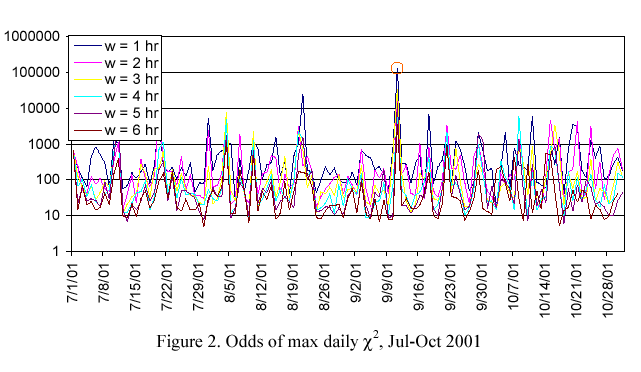
A third set of independent analyses has been generated by Richard
Shoup, who has examined the data from the beginning of July to the end of
October to see empirically how unusual September 11 is. A paper describing
his survey, available at the Boundary
Institute contains interesting perspectives. An analysis of the
increase in variance on each day over the four-month period, for example,
shows that the largest peak by far occurs on September 11. He uses
smoothing windows of various widths and reports that they all peak on the
llth. He calculates odds of 131,000 to 1 for the
largest spike, produced with a one-hour smoothing window.
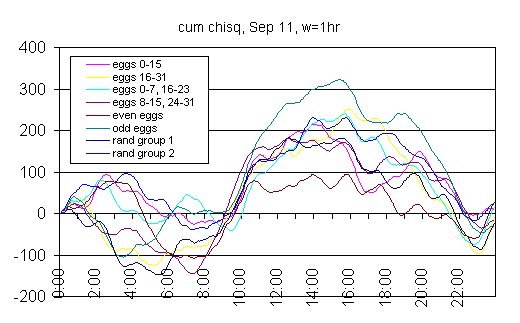
In addition, Shoup looks at correlations and trends in variance. Here
is an example, where 32 of the 37 eggs (those with no missings) are
divided several ways into two groups of 16, and the cumulative deviation
of the sum of squared Z-scores plotted separately. The parallel trends
beginning at about 08:00, GMT, suggest substantial inter-egg correlation.
A similar analysis on Aug 11 and on Sept 10 shows no similar pattern.
Discussion and Interpretation
Using exploratory methods to visualize structure in the data, it
appears from various perspectives that there is a concentration of strong
deviations around the major events of September 11. A far more
comprehensive survey of such explorations, including analyses by Dean
Radin and Peter Bancel, is available in an extended analysis
page. Some focused work addresses still other aspects of the GCP data. One
important question, both theoretically and practically, is whether
distance makes a difference. Dean Radin has done a careful analysis of results by
location that is detailed in the context of validity checks on the
procedures, and studies of the timing of the egg network response. Another
independent analysis, by Peter Bancel, looks at autocorrelation
of the Stouffer Z-scores. This perspective assesses the correlation across
time, which is independent of correlations across the eggs. A strongly
skeptical look is provided by Ed May and James Spottiswoode in their critical
analysis of selected items from the formal and exploratory work by
Roger Nelson and Dean Radin. (downloadable pdf file, about 55 K.)
To begin a discussion of these remarkable results, I must acknowledge
that the very best we can do is to report the data honestly and
completely, because we do not have a theoretical understanding of the sort
that must underlie robust interpretations. Of course we try hard to
understand, and we are asked to explain the results. It is important to
identify the answers we give as speculative and provisional, but having
said that, I would like to describe a speculation that appeals especially
to my aesthetic self, to my right brain. You can find more general
discussion of alternatives and cautions elsewhere on the website.
One way to think of these startling correlations is to accept the
possibility that the instruments have captured the reaction of a global
consciousness beginning to form. The network was built to do just that: to
see whether we could gather evidence of a communal, shared mind in which
we are participants even if we don't know it.
Groups of people, including the group that is the whole world, have a
place in consciousness space, and under special circumstances they
or we become a new presence. Based on evidence that both individuals
and groups manifest something we can tentatively call a consciousness
field, we hypothesized that there could be a global consciousness capable
of the same thing. Pursuing the speculation, it would seem that the new,
integrated mind is just beginning to be active, paying attention only to
events that inspire strong coherence of attention and feeling. Perhaps the
best image is an infant slowly developing awareness, but already capable
of strong emotions in response to the comfort of cuddling or to the
discomfort of pain.
The hypothesis we set out to test is that the REG devices we use may
respond to the concerted effect of large numbers of people turning their
attention in one direction, becoming absorbed in the same focus. The
terrible events of September 11 were a powerful magnet for our shared
attention, and more than any event in the recent memory of the world they
evoked the extraordinary emotions of horror and fear and commiseration and
dismay.
The EGG network reacted in a powerful and evocative way. While there
certainly are sensible alternative explanations, this is not a mistake or
a misreading. It can be interpreted as a clear, if indirect, confirmation
of the hypothesis that the eggs' behavior is affected by global events and
our reactions to them. More important than any scientific question,
however, is the question of meaning. What shall we learn, and what should
we do in the face of compelling evidence that there may be such a thing as
global consciousness? In fact this is not a new question. The results from
this scientific study are an apparent manifestation of the ancient idea
that we are all interconnected, and that what we think and feel has
effects on others, everywhere in the world. The implication of the GCP/EGG
data reflecting our shock and dismay is in some sense quite obvious. It
says that even insensate electronic random generators can see the effects
of hatred born of pain and despair. It means that the earth cannot support
us in comfort as things now are. It urges a new understanding that we must
learn to accept each other and help and support each other, everywhere in
the world, if we are to live in peace on this beautiful earth.
More
Many other analyses and graphs have been generated, and some show
certain details and perspectives that may interest you. The extended analysis
page has most of the figures shown here, but in the context of the
developing analysis program over the first few days following the tragedy.
The data are treated in with different procedures by Dean Radin and Peter
Bancel in a series of explorations seeking more insight. They require very
careful interpretation so are not included in this primary summary of the
September 11 results. There
is also an Interpretations
page in the works, and one that simply presents the flood of messages from
people all over the world who are involved in the GCP/EGG project. For
more details about the project itself, you can go to the GCP home
page where you will find links to all aspects.